
MS Biostatistics · University of Michigan · Class of 2028

McKenzie Hebert

Biostatistics graduate student with experience in predictive modeling, time series forecasting, and statistical analysis of clinical and public health data.

Seeking a summer 2027 internship in biostatistics or statistical programming

McKenzie Hebert
7.8% of visits, Feb 2025
Weekly share of outpatient visits for influenza-like illness, United States, 2010 to 2025. CDC ILINet. This is the series behind her influenza forecasting capstone.

About

I'm a master's student studying Biostatistics at the University of Michigan. I am interested in opportunities in biostatistics such as cancer research, clinical trials, pharmaceuticals, and biotechnology.

As an undergraduate I earned dual degrees in Data Science and Anthropology at Arizona State University as part of Barrett, the Honors College. This interdisciplinary approach lets me explore my love for human stories and public health while building proficiency in R, Python and statistical modeling.

I'm eager to apply my statistical modeling and problem solving skills to contribute to better health outcomes for everyone.

Program
MS BiostatisticsUniversity of Michigan School of Public Health
Graduation
May 2028
Undergraduate
BS Data Science, BS AnthropologyArizona State University, Barrett, the Honors College
GPA
4.0, summa cum laude
Interests
Clinical trials, cancer research, pharmaceuticals, biotechnology
Based in
Ann Arbor, Michigan

Research

University of Michigan Big Data Summer Institute · Cancer Data Science · Jun to Aug 2025

Recurrence risk assessment for treated breast cancer patients

XGBoost · SMOTE · Calibration · R Shiny

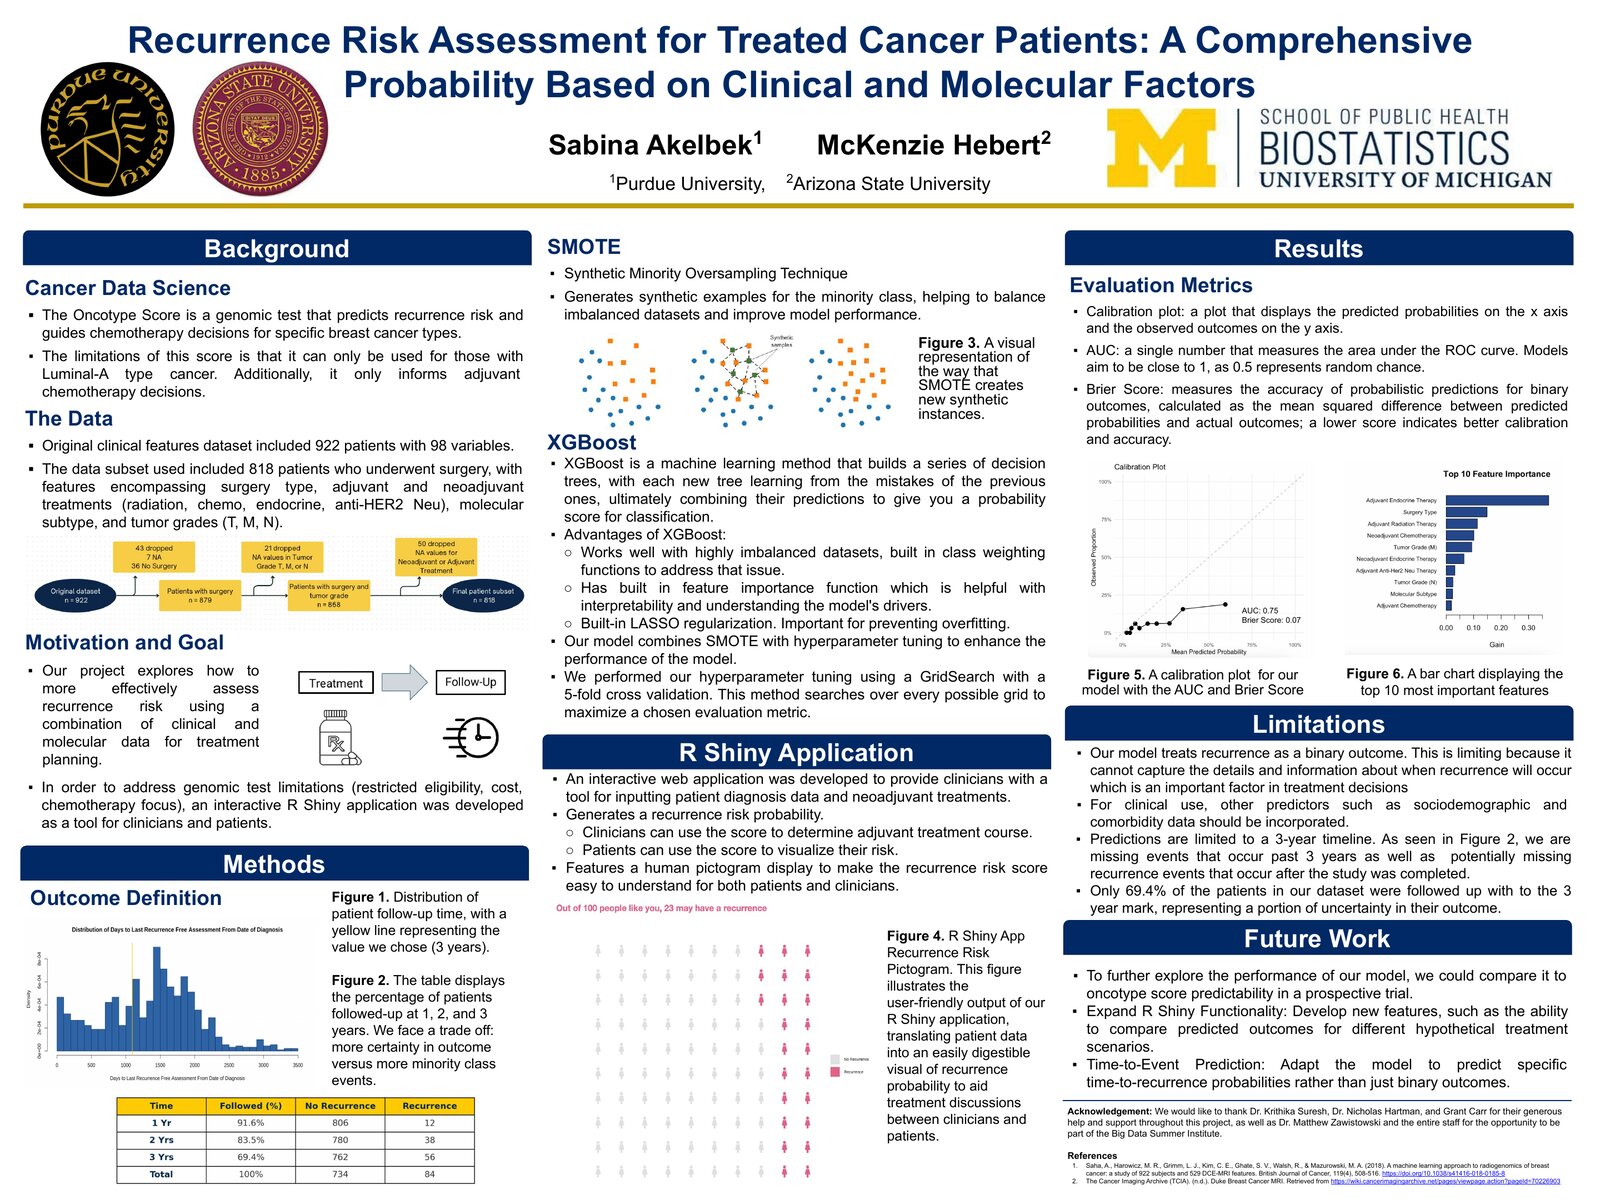
The Oncotype score predicts recurrence risk for only some breast cancer types and informs only chemotherapy decisions. This project built a model on a broader set of clinical and molecular factors, then put it in an R Shiny app that clinicians and patients can read.

922patients in source data
818in the modeling cohort
98variables
0.75AUC
0.07Brier score

Cohort

922Original dataset
879Underwent surgery
858Tumor grade recorded
818Treatment data complete

Follow-up and events

WindowFollowedRecurrences
1 year91.6%12
2 years83.5%38
3 years69.4%56
A longer window captures more events and loses certainty about outcome. The team chose 3 years, then used SMOTE to handle 56 recurrences among 818 patients.

What the app shows a patient

Out of 100 people like you, 23 may have a recurrence

Example output of the R Shiny app, redrawn from the symposium poster. A probability becomes a count of people, which is easier to discuss in a clinic.

Approach

  • Defined recurrence as a binary outcome within 3 years of diagnosis.
  • Balanced the minority class with SMOTE and tuned XGBoost by grid search with 5-fold cross validation.
  • Chose the Brier score as the primary metric to judge calibration of predicted probabilities, with AUC alongside.
  • Built and deployed the R Shiny app that takes diagnosis and treatment inputs and returns a risk probability.

Limitations and next steps

  • A binary outcome drops timing. Next step is time-to-event prediction.
  • Only 69.4% of patients were followed to the 3-year mark.
  • Sociodemographic and comorbidity predictors would be needed for clinical use.
  • Compare against Oncotype score predictions in a prospective trial.
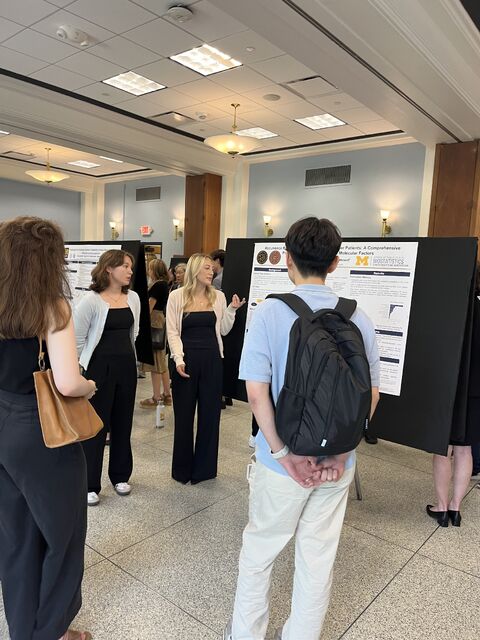
McKenzie presenting the poster at the BDSI symposium
Poster session, BDSI symposium, July 2025
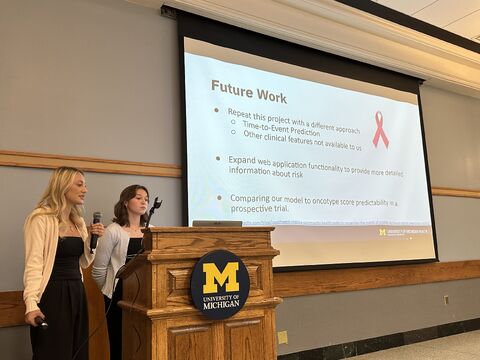
McKenzie presenting the project talk at the University of Michigan
Symposium talk, University of Michigan
Research poster: Recurrence Risk Assessment for Treated Cancer PatientsOpen the poster

With Sabina Akelbek (Purdue University). Mentors: Dr. Krithika Suresh, Dr. Nicholas Hartman and Grant Carr. Data: Duke Breast Cancer MRI, The Cancer Imaging Archive (Saha et al., 2018).

Arizona State University DESERT Aging Lab · PI Dr. Rachel Koffer · Aug 2025 to present

Routines versus Diversity: Daily Activity Sequences Predict Self-Reported Sleep Quality in Older Adults

Sequence analysis · Longitudinal diary data · R

Sequence analysis in R on daily activity diaries from older adults, asking which kinds of daily activity patterns go with better self-reported sleep.

144older adults
812days of observation
6time points per day
7days per participant

The method

Schematic of a sequence index plot. Each row is one day, each cell a time of day, and color is the activity recorded. Illustrative only. Study results are held until publication.

Role

  • Conduct the sequence analysis in R.
  • Draft manuscript sections and prepare figures for a peer-reviewed publication.
  • Prepared the abstract for the SBSM 2026 Annual Scientific Meeting.
  • Literature reviews and visualizations for weekly research team meetings.

Status

  • Poster presented at the ASU College of Health Solutions Student Research Symposium, spring 2026.
  • Manuscript in preparation.
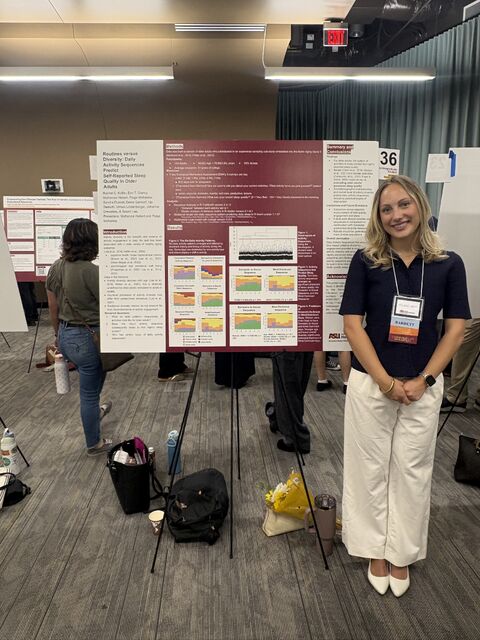
McKenzie beside the research poster at the ASU symposium

Projects

More on GitHub.

Data Science Capstone · Arizona State University · Aug to Dec 2025

Forecasting Seasonality and Magnitude of Influenza

Forecasting weekly influenza-like illness at the national level and for California, to help hospitals anticipate periods of higher strain. Data came from CDC ILINet and the California Department of Public Health.

Python, R, statsmodels, scikit-learn, MAPIE, Tableau

With Kassia Crouse and Jamie Yu.

Data Science Intern · Arizona State University Swim and Dive · Sep 2024 to May 2025

ASU Swim and Dive Performance Analytics

Worked with the coaching staff of a Division I program to turn practice and meet data into training decisions.

R, Python, Excel

Course project · Arizona State University · 2025

Predicting Song Popularity

Can streaming success be predicted from audio features, release timing and chart performance? Built on the Spotify 2023 dataset of 953 songs and 24 features.

Python, pandas, scikit-learn, Matplotlib, Seaborn

Honors Thesis · Barrett, the Honors College · Founder's Lab, 2024 to 2025

Ballot Binge

A year-long, three-person entrepreneurship thesis that took an idea from concept to company. Ballot Binge is a swipe-style app that gives voters unbiased candidate and proposition profiles for their area, then compiles their choices into a personal voter guide to take to the polls.

Survey design, user interviews, Figma

With Kenzie Jarnagin and Kennedi Humble. Thesis director Jared Byrne, second reader John Pierce.

Volunteer · University of Michigan · Sep 2026 to present

Statistics in the Community (STATCOM)

Pro bono statistical consulting for nonprofit organizations in the Ann Arbor area. Project work will be added here as it finishes.

Experience

  1. Undergraduate Research AssistantASU DESERT Aging Lab · Tempe, AZSequence analysis in R on daily activity patterns and sleep quality in older adults.
  2. Undergraduate Research AssistantUniversity of Michigan Big Data Summer Institute · Ann Arbor, MIXGBoost recurrence risk model and R Shiny app with the Cancer Data Science group.
  3. Data Science InternASU Swim and Dive · Tempe, AZPredictive models in R and Python on training load and recovery.
  4. Operations AssistantASU Greek Leadership Community Center · Tempe, AZ
  5. Director of EcommerceThe Silver Wren · Shopify, Etsy and Google Merchant Center, 30,000+ five-star reviews

Education

MS Biostatistics University of Michigan School of Public Health

Coursework: Linear Regression Theory, Probability and Inference, Epidemiology

BS Data Science, BS Anthropology Arizona State University · Barrett, the Honors College

4.0 GPA, summa cum laude. Data Science on the Business Data Analytics track.

McKenzie at Arizona State University graduation

Leadership and service

  1. Statistical Consulting VolunteerStatistics in the Community (STATCOM), University of Michigan
  2. Vice President of AcademicsDelta Zeta Sorority · 330+ members, chapter GPA from 3.15 to 3.22

Awards

Skills

Programming

R
Strong
Python
Strong
SQL
Moderate
SAS
In progress

Statistical methods

  • Regression analysis
  • ANOVA
  • Hypothesis testing
  • Time series (SARIMA, ARIMA)
  • Sequence analysis
  • Survival analysis
  • Gradient boosting
  • Random forests
  • Model calibration
  • Cross validation

Packages and tools

  • R Shiny
  • ggplot2
  • scikit-learn
  • XGBoost
  • LaTeX
  • Tableau
  • Excel
  • Figma

Coursework and training

  • Linear Regression Theory
  • Probability and Inference
  • Epidemiology
  • Causal inference
  • Bayesian inference
  • Clinical trial design
  • Electronic health records

Study Abroad

Florence, Italy · Summer 2024

Florence University of the Arts

I studied abroad with International Studies Abroad (ISA) at the Florence University of the Arts. I had the opportunity to immerse myself in the Italian language and culture and to take on coursework that broadened my horizons. The experience deepened my appreciation for cultural diversity and taught me more about other ways of life.

Program
International Studies Abroad (ISA)
Host
Florence University of the Arts
Length
One month

Resume

Download PDF

Your browser can't show the PDF inline. Open the resume.

Contact